Traditional price charts display many harmonic patterns, including the bat, Gartley, butterfly, 5.0, crab, and AB=CD patterns. Each has a bearish and bullish variant, which means that when the pattern is upside down, it might imply a price rise or decline. Each pattern has its own formation and, more crucially, its own set of Fibonacci ratios.
All financial markets, including stock CFDs, commodity CFDs, and Forex CFDs, could benefit from harmonic patterns.
Let's see how these harmonic patterns are formed and how you could use them in your trading strategy.
Bat harmonic pattern
The bullish Bat pattern resembles a stretched-out "M." The price climbs, increasing an X-to-A leg before retracing a little more than 0.618 of XA. The optimal retracement here is 0.382 to 0.50. Then there is another rise up, as illustrated by "BC," which retraces wave AB from 0.382 to 0.886. This is followed by a lower-level wave known as CD, which is a 1.618 to 2.618 extension of BC.
Point D should be after a retracement of XA of 0.886. From this possible reversal zone, the price is expected to rise. Many traders wait for the price to begin climbing before opening a buy position. A stop-loss order is set below the most recent swing low, which is either at D or below X.
Profit objectives are based on Fibonacci ratios, with the possibility of extending higher than A. Popular take-profit levels include 0.50, 0.618, 1 (at A), and 1.618 (above A) since they might serve as future support and resistance levels.
Bearish Bat harmonic pattern resembles a stretched-out "W." The ratios are identical, with the exception that the pattern begins with a price fall from X to A. AB represents a motion upward, BC represents a move downward, and CD represents a wave upward. Point D illustrates where traders would look for a price decrease, explaining why it is a bearish pattern.

ABCD harmonic pattern
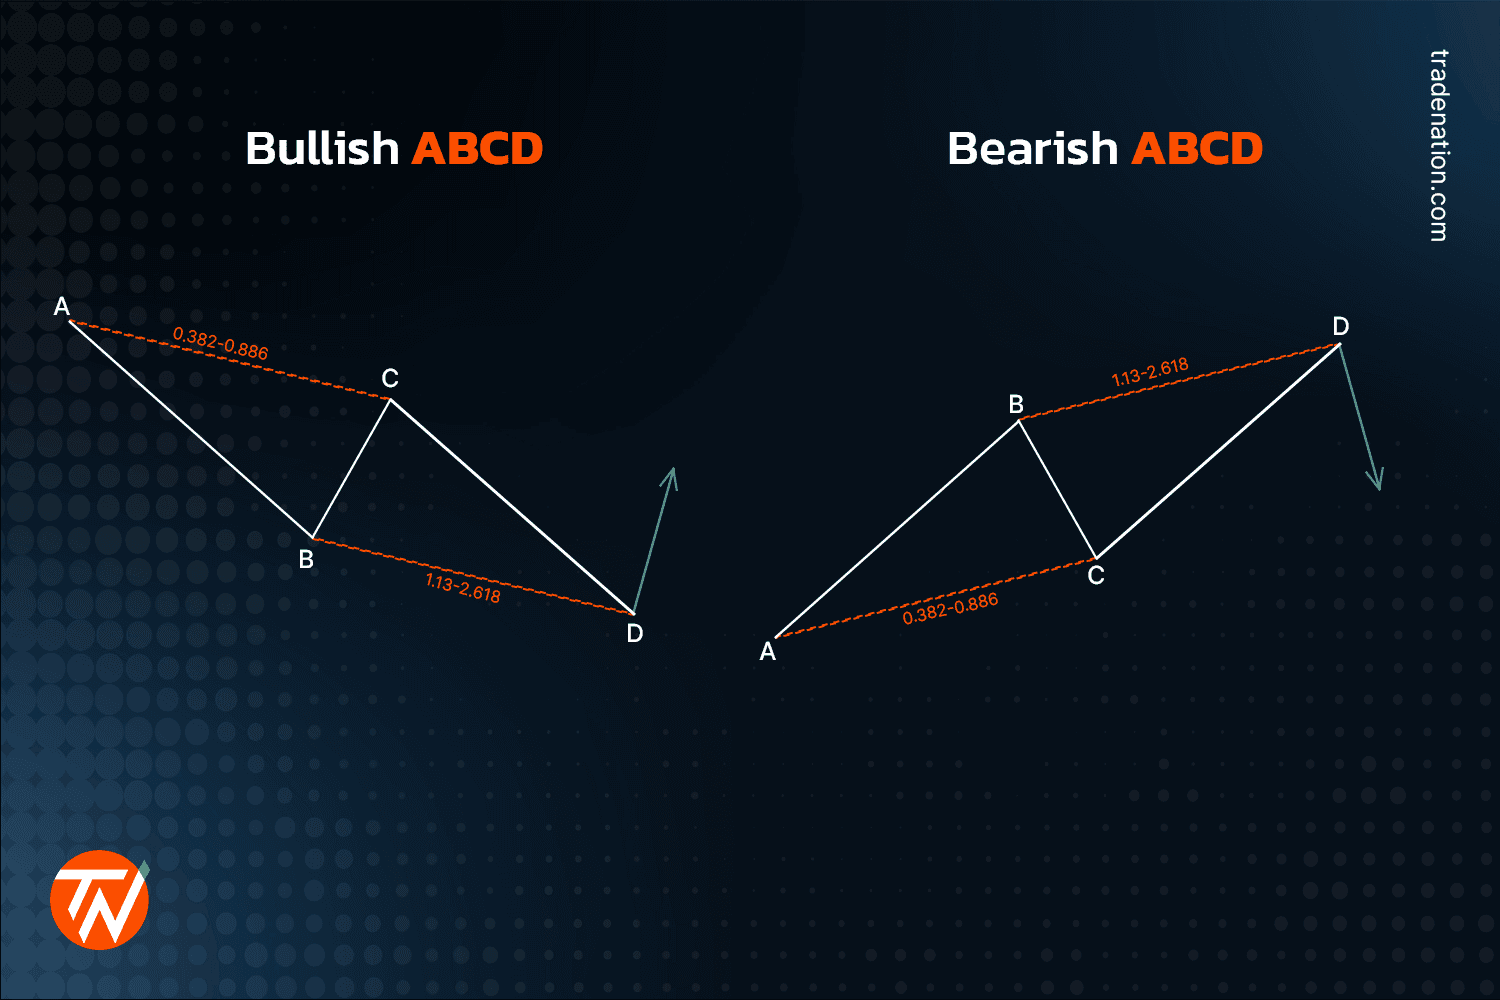
The ABCD pattern functions significantly differently from the others. In the case of a bullish ABCD pattern, the AB leg goes down. BC retraces 0.382 to 0.886 of AB. Once C is determined, point C minus the length of AB yields point D. Traders should aim for a higher reversal at point D.
The ratios for bearish ABCD are the same. As the price approaches D, traders may decide to go short if the price falls from the zone. A stop-loss order is placed above the most recent swing high.
Because the trend might be pretty strong and you're trading a likely reversal trend, you should consider setting your profit targets between points D and C. A Fibonacci retracement tool might be utilised, with objectives set at 0.50, 0.618, or 1.
Gartley harmonic pattern
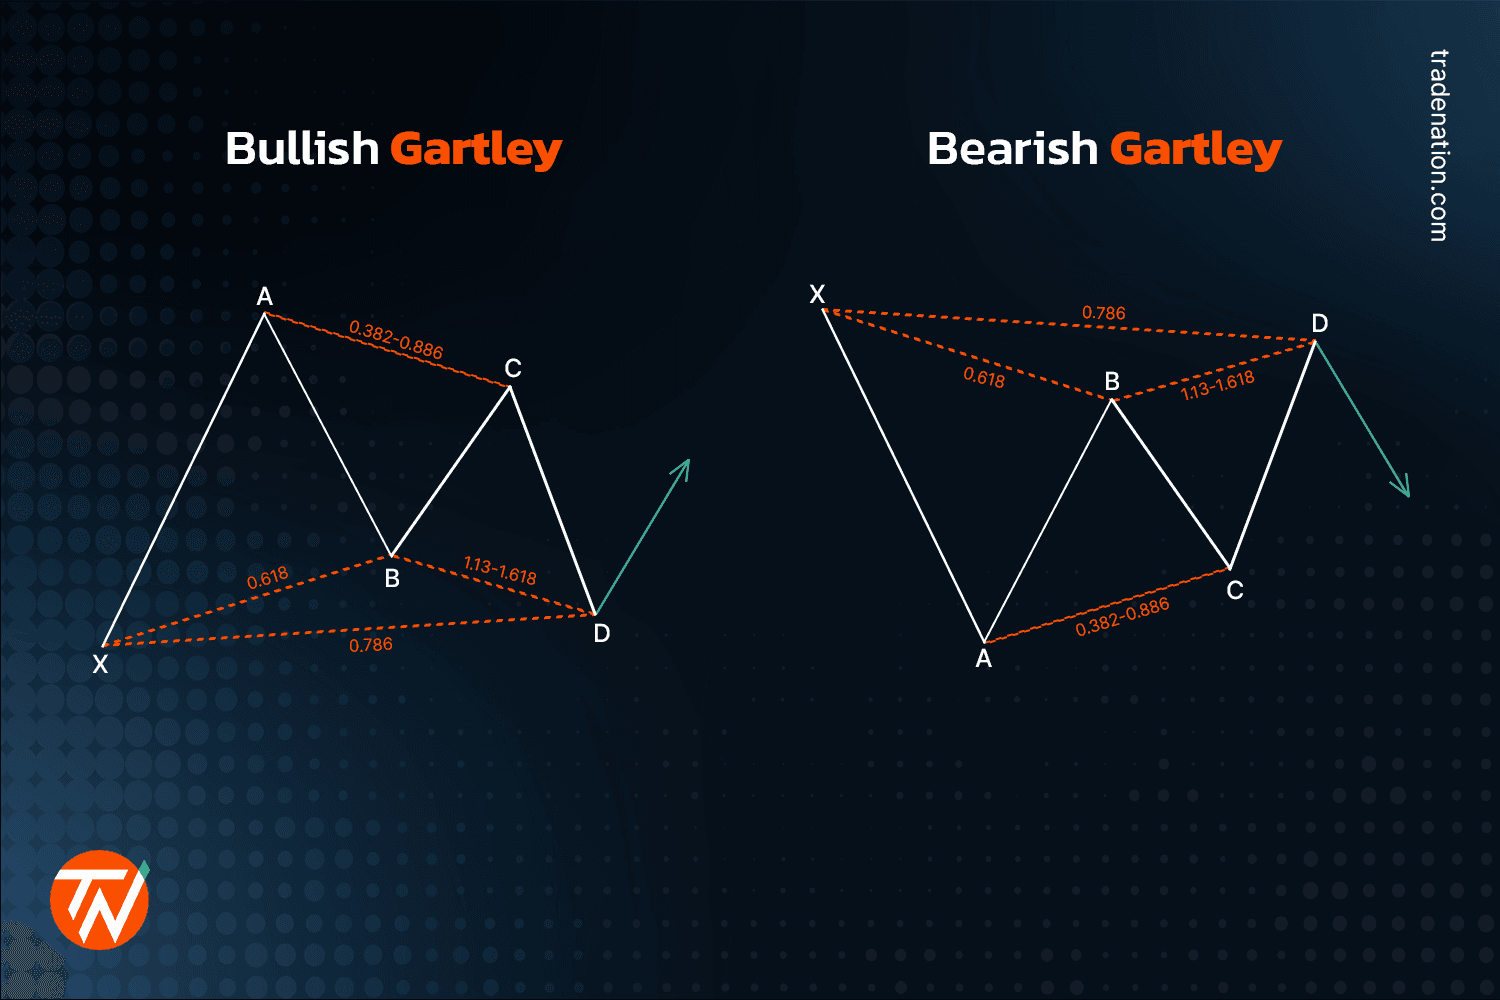
The Gartley design resembles the bat in appearance, but the ratios are different.
The bearish Gartley pattern has the same ratios as the bullish Gartley pattern, only it begins with an XA leg down. For a bullish Gartley pattern, XA is the first leg up. AB is a 0.618 retracement to XA. BC is another leg up, retracing 0.382 to 0.886 of AB. CD is a leg down, extending from 1.13 to 1.618 of BC. Point D is near the XA retracement level of 0.786.
Once the price begins to fall after D, the stop-loss is placed immediately above the swing high at D. It might also be positioned above X, but this will significantly raise the stop-loss size.
Profit targets include AD retracement and extension levels of 0.50, 0.618, 1, and 1.618. In the future, they might serve as both support and opposition.
Butterfly harmonic pattern
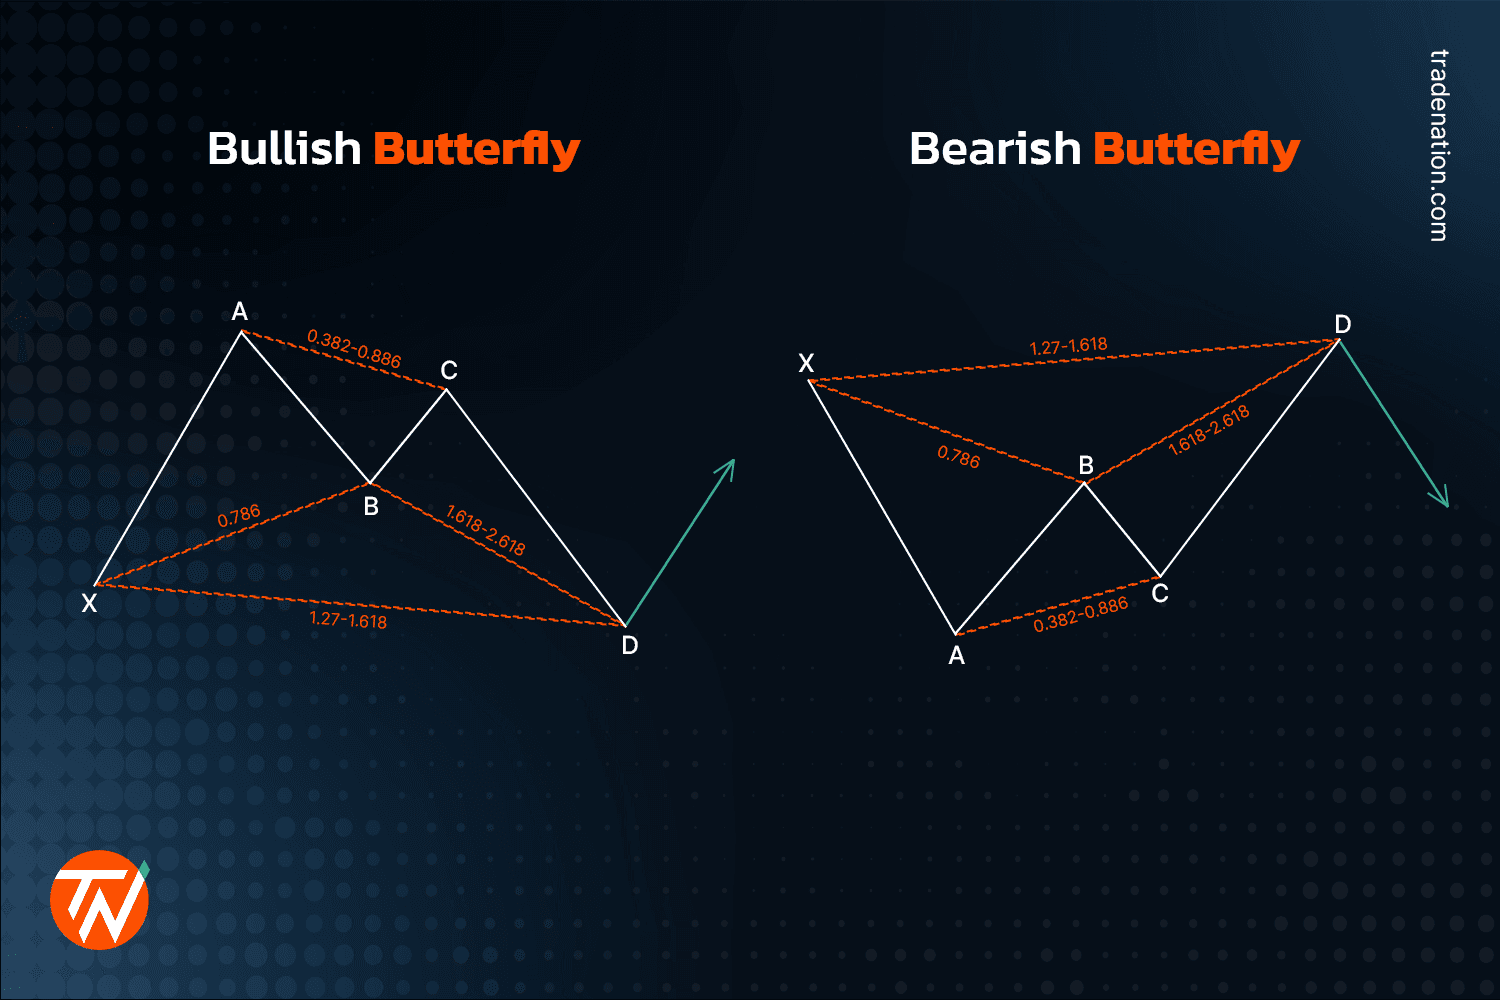
The harmonic butterfly pattern resembles the Gartley, but with different ratios and the fact that point D extends lower than point X. The Fibonacci levels for a bearish butterfly pattern are as follows: XA is the first leg down. AB is a leg up that retraces at 0.786 of XA. BC is a leg down again that retraces AB from 0.382 to 0.886. CD leg rises from 1.618 to 2.24 of AB. D is always higher than X, with an XA extension of around 1.27.
The bullish Butterfly pattern has the same ratios as the bearish Butterfly pattern, except it begins with an up XA leg up.
In the case of a bearish butterfly, the price drops lower from point D in anticipation of a selloff, and the stop-loss order is placed above the swing high at D. Take profit is estimated using AD Fibonacci ratios. Take-profit targets commonly used include 0.50, 0.618, 1, and 1.618.
Crab harmonic pattern
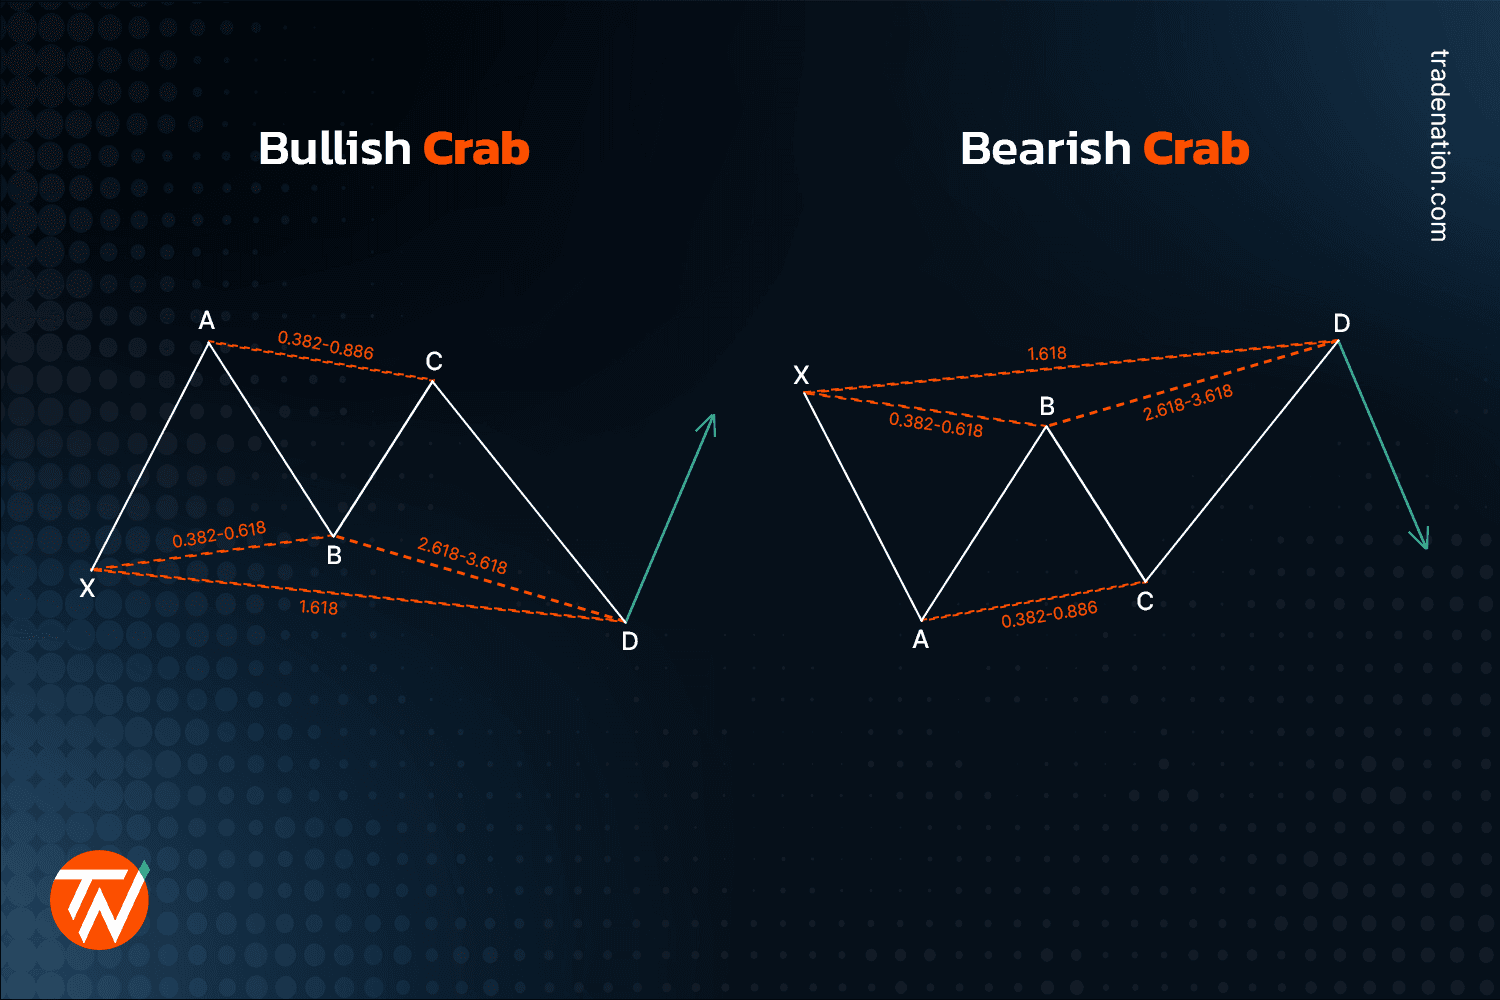
Yet another Scott Carney discovery, the crab follows an X-A, A-B, B-C, and C-D pattern, allowing traders to enter the market at extreme highs or lows. The 1.618 extension of the XA leg to the CD leg that defines it is the crab pattern's most crucial characteristic.
The first leg of the crab in its bullish variant emerges when the price climbs significantly from point X to point A. The AB leg retraces 38.2% to 61.8% of XA. This is followed by an extreme projection of BC (2.618 - 3.618), which defines a viable region for pattern completion and likely trend reversal.
A bearish crab will follow a price drop from point X to point A, then a minor price gain, a tiny drop, then a rapid climb to point D.
In the case of a bullish crab, once point D is identified, traders could wait for the start of a selloff to enter and place a stop loss above point D. The opposite is done while trading a bearish crab harmonic pattern.
5.0 harmonic pattern
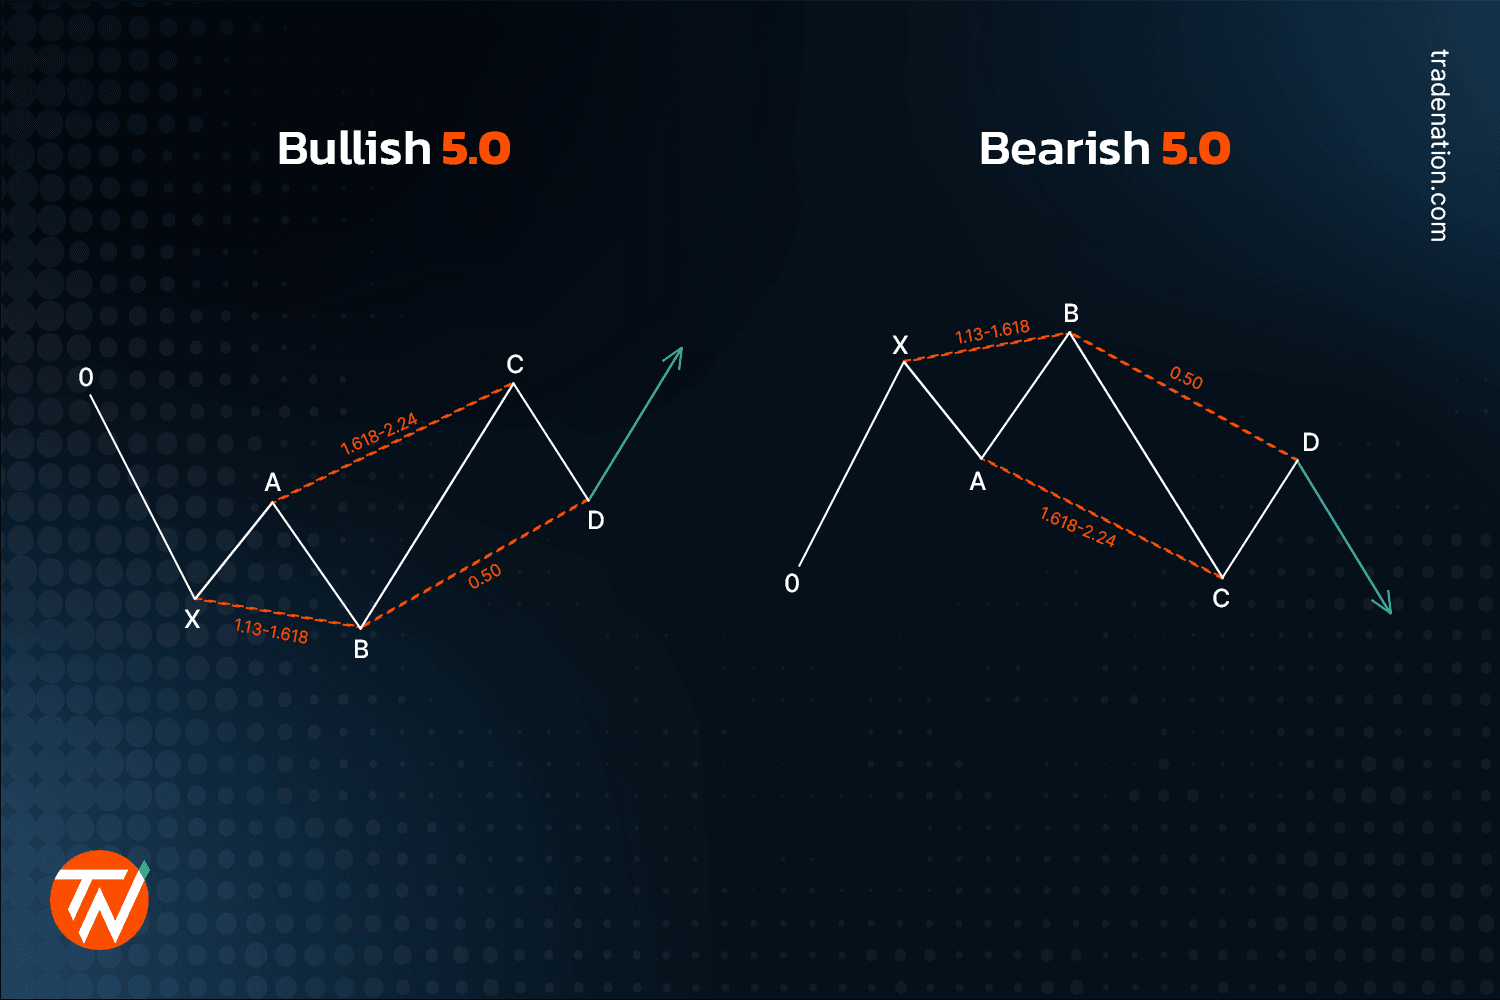
This is a little more complicated pattern since it includes an ABCD as well as the leg before it. Here are the Fibonacci levels to look for a bullish 5.0 harmonic pattern:
- A leg down labelled 0X, and a leg up labelled XA
- AB is a down leg that extends from 1.13 to 1.618 beyond point X
- BC is again a leg up that extends from 1.618 to 2.24 of XA
- In the end, the CD is a leg down that retraces 0.50 of BC.
In case of a bullish 5.0 harmonic pattern, you might want to wait for the price to rise from point D before entering the market. As we do not yet know if the price will move as predicted, there is no trade if the price continues to fall; only if the price rises will there be a trade.
Once the price rises, a stop-loss is placed below the swing low produced at point D. Profit targets are predicted between points D and C, although they might also be projected above C. The bearish pattern functions similarly, except for the opposite in formation and bias.