14 March 2024 - 9min Read

Trading patterns

Harmonic patterns

In technical analysis, harmonic patterns are among the most efficient trading patterns. They are more complex than other patterns and can assist technical analysts in interpreting even more market price action information.

They use price action analysis and mathematical tools to generate geometrical structures that give more qualified market trading ideas. Harmonic patterns, in essence, allow traders to see the order in chaotic market movement and understand how price swings and retracements link with Fibonacci sequences.

Harmonic patterns provide powerful, high-probability trading opportunities with distinct entry, stop and target points likely to offer appealing risk-to-reward ratios.

TABLE OF CONTENTS

Key takeaways

  • Harmonic trading is the concept that trends are harmonic phenomena, which means they may be separated into smaller or bigger waves that can anticipate price direction.
  • Fibonacci numbers are used to build technical indicators in harmonic trading.
  • The Fibonacci sequence of numbers is formed by adding the preceding two numbers: 0, 1, 1, 2, 3, 5, 8, 13, 21, 34, 55, 89, 144, 233, and so on.
  • This sequence may then be split down into ratios, which many believe can predict where a particular financial market will go.
  • The ABCD, Gartley, bat, butterfly, and crab harmonic patterns are the most popular among technical traders.

Marc Aucamp

Content Writer

Liked this article? Share now on socials

How do harmonic patterns work?

Unlike typical chart patterns, a harmonic pattern must fulfil precise movement conditions to be recognised as a genuine and tradeable pattern. This eliminates the subjectivity of trading classic chart patterns and makes it more objective. Because the movement criteria are based on Fibonacci retracements and extensions, trading harmonic patterns requires mastery of these Fibonacci tools.

Harmonic patterns are intended to detect market reversals. In a trending market, Fibonacci retracements are used to discover levels where the price is expected to resume the direction of the main trend, whilst Fibonacci extensions are used to predict targets (take profit).

Best harmonic patterns

Traditional price charts display many harmonic patterns, including the bat, Gartley, butterfly, 5.0, crab, and AB=CD patterns. Each has a bearish and bullish variant, which means that when the pattern is upside down, it might imply a price rise or decline. Each pattern has its own formation and, more crucially, its own set of Fibonacci ratios.

All financial markets, including stocks, commodities, and the FX market, can benefit from harmonic patterns.

Let's see how these harmonic patterns are formed and how you can use them in your trading strategy.

Bat harmonic pattern

The bullish Bat pattern resembles a stretched-out "M." The price climbs, making an X-to-A leg higher before retracing a little more than 0.618 of XA. The optimal retracement here is 0.382 to 0.50. Then there is another rise up, as illustrated by "BC," which retraces wave AB from 0.382 to 0.886. This is followed by a lower-level wave known as CD, which is a 1.618 to 2.618 extension of BC.

Point D should be after a retracement of XA of 0.886. From this possible reversal zone, the price is expected to rise. Many traders wait for the price to begin climbing before opening a buy position. A stop-loss order is set below the most recent swing low, which is either at D or below X.

Profit objectives are based on Fibonacci ratios, with the possibility of extending higher than A. Popular take-profit levels include 0.50, 0.618, 1 (at A), and 1.618 (above A) since they might serve as future support and resistance levels.

Bearish Bat harmonic pattern resembles a stretched-out "W." The ratios are identical, with the exception that the pattern begins with a price fall from X to A. AB represents a motion upward, BC represents a move downward, and CD represents a wave upward. Point D illustrates where traders would look for a price decrease, explaining why it is a bearish pattern.

Bullish bat vs bearish bat demonstrated

ABCD harmonic pattern

The ABCD pattern functions significantly different than the others. In the case of a bullish ABCD pattern, the AB leg goes down. BC retraces 0.382 to 0.886 of AB. Once C is determined, point C minus the length of AB yields point D. Traders should aim for a higher reversal at point D.

The ratios for bearish ABCD are the same. As the price approaches D, traders may decide to go short if the price falls from the zone. A stop-loss order is placed above the most recent swing high.

Because the trend might be pretty strong and you're trading a likely reversal trend, you should consider setting your profit targets between points D and C. A Fibonacci retracement tool might be utilised, with objectives set at 0.50, 0.618, or 1.
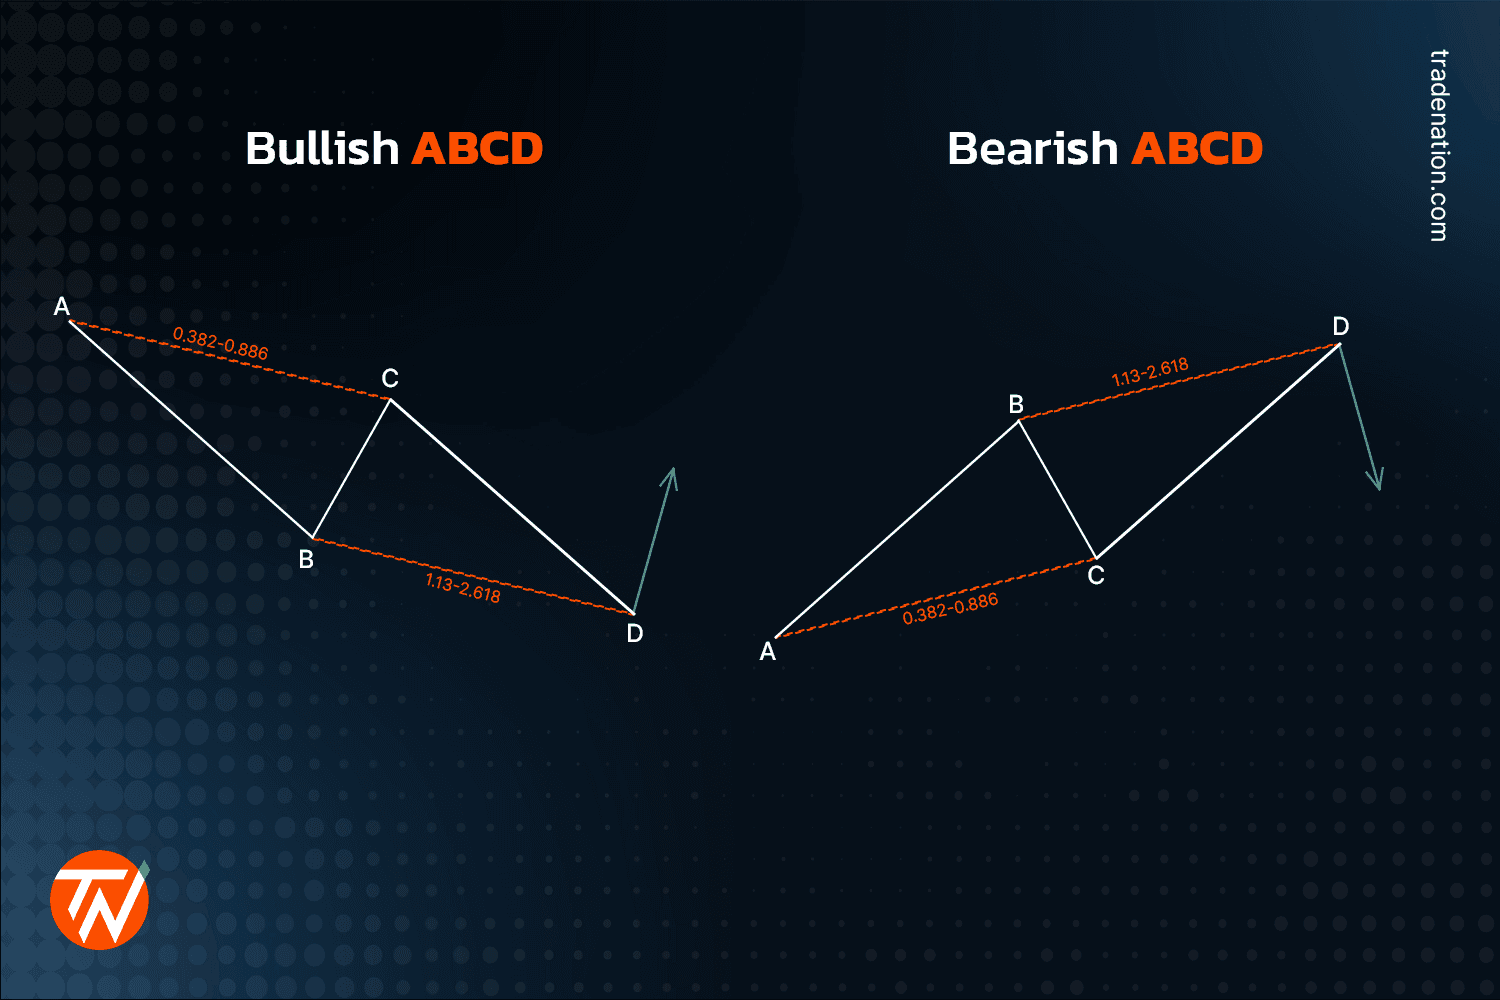
Bullish and bearish ABCD demonstrated

Gartley harmonic pattern

The Gartley design resembles the bat in appearance, but the ratios are different. 

The bearish Gartley pattern has the same ratios as the bullish Gartley pattern, only it begins with a XA leg down. For a bullish Gartley pattern, XA is the first leg up. AB is a 0.618 retracement to XA. BC is another leg up, retracing 0.382 to 0.886 of AB. CD is a leg down, extending from 1.13 to 1.618 of BC. Point D is near the XA retracement level of 0.786.

Once the price begins to fall after D, the stop-loss is placed immediately above the swing high at D. It might also be positioned above X, but this will significantly raise the stop-loss size.

Profit targets include AD retracement and extension levels of 0.50, 0.618, 1, and 1.618. In the future, they might serve as both support and opposition.
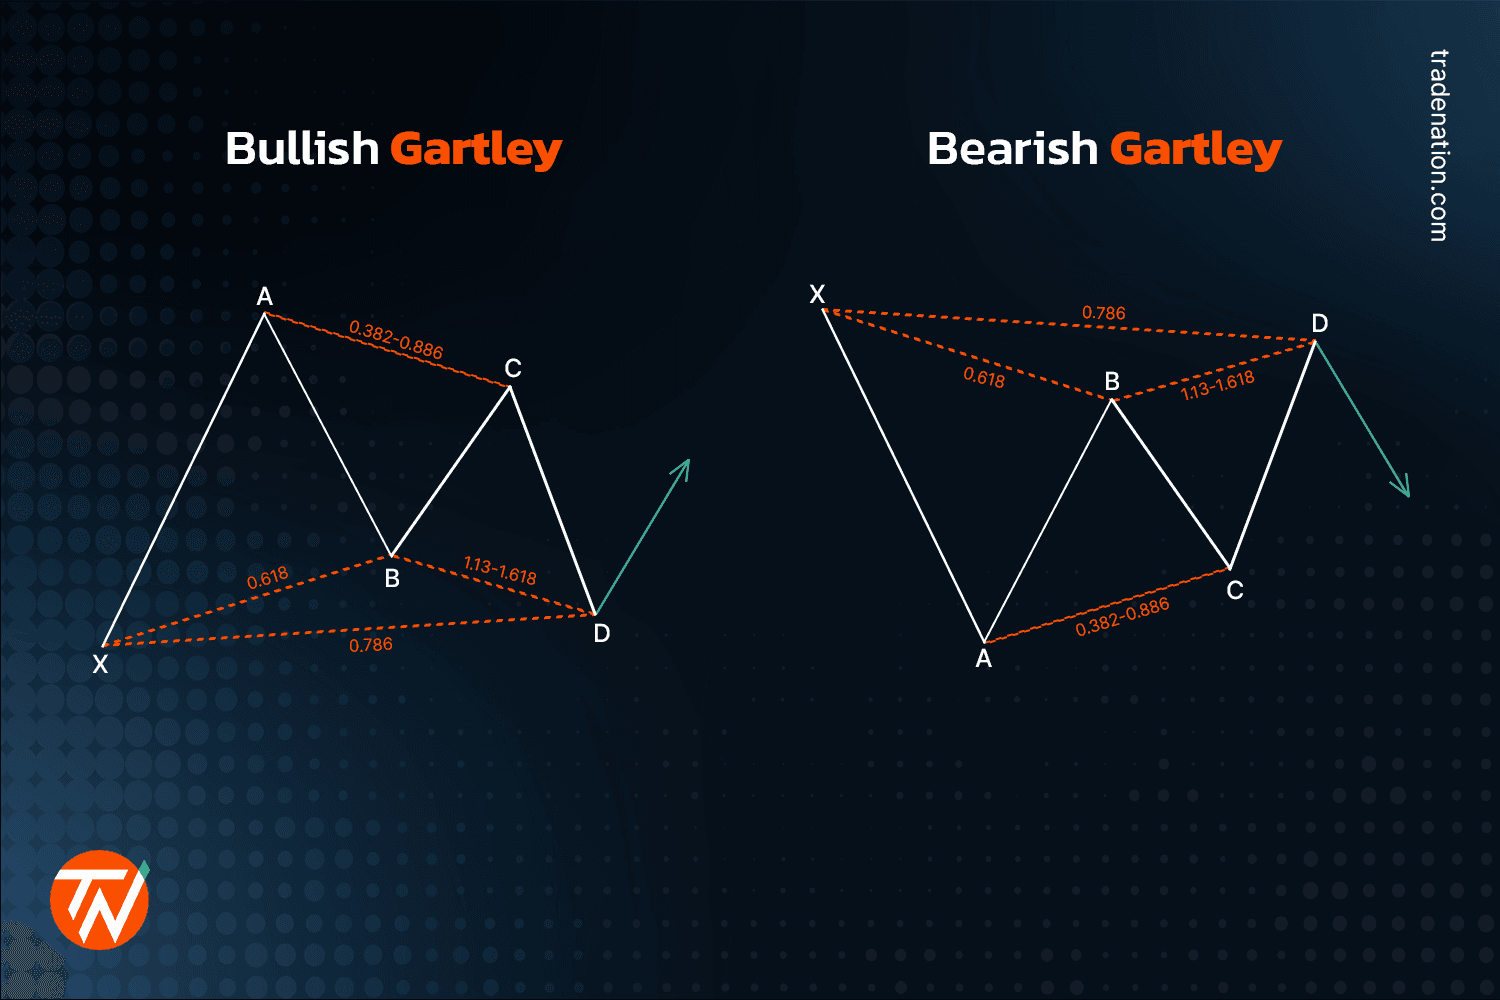
Bullish gartley vs bearish gartley demonstrated

Buttefly harmonic pattern

The harmonic butterfly pattern resembles the Gartley but with different ratios and the fact that point D extends lower than point X. The Fibonacci levels for a bearish butterfly pattern are as follows: XA is the first leg down. AB is a leg up that retraces at 0.786 of XA. BC is a leg down again that retraces AB from 0.382 to 0.886. CD leg rises from 1.618 to 2.24 of AB. D is always higher than X, with a XA extension of around 1.27.

The bullish Butterfly pattern has the same ratios as the bearish Butterfly pattern, except it begins with an up XA leg up.

In the case of a bearish butterfly, the price drops lower from point D in anticipation of a selloff, and the stop-loss order is placed above the swing high at D. Take profit is estimated using AD Fibonacci ratios. Take-profit targets commonly used include 0.50, 0.618, 1, and 1.618.
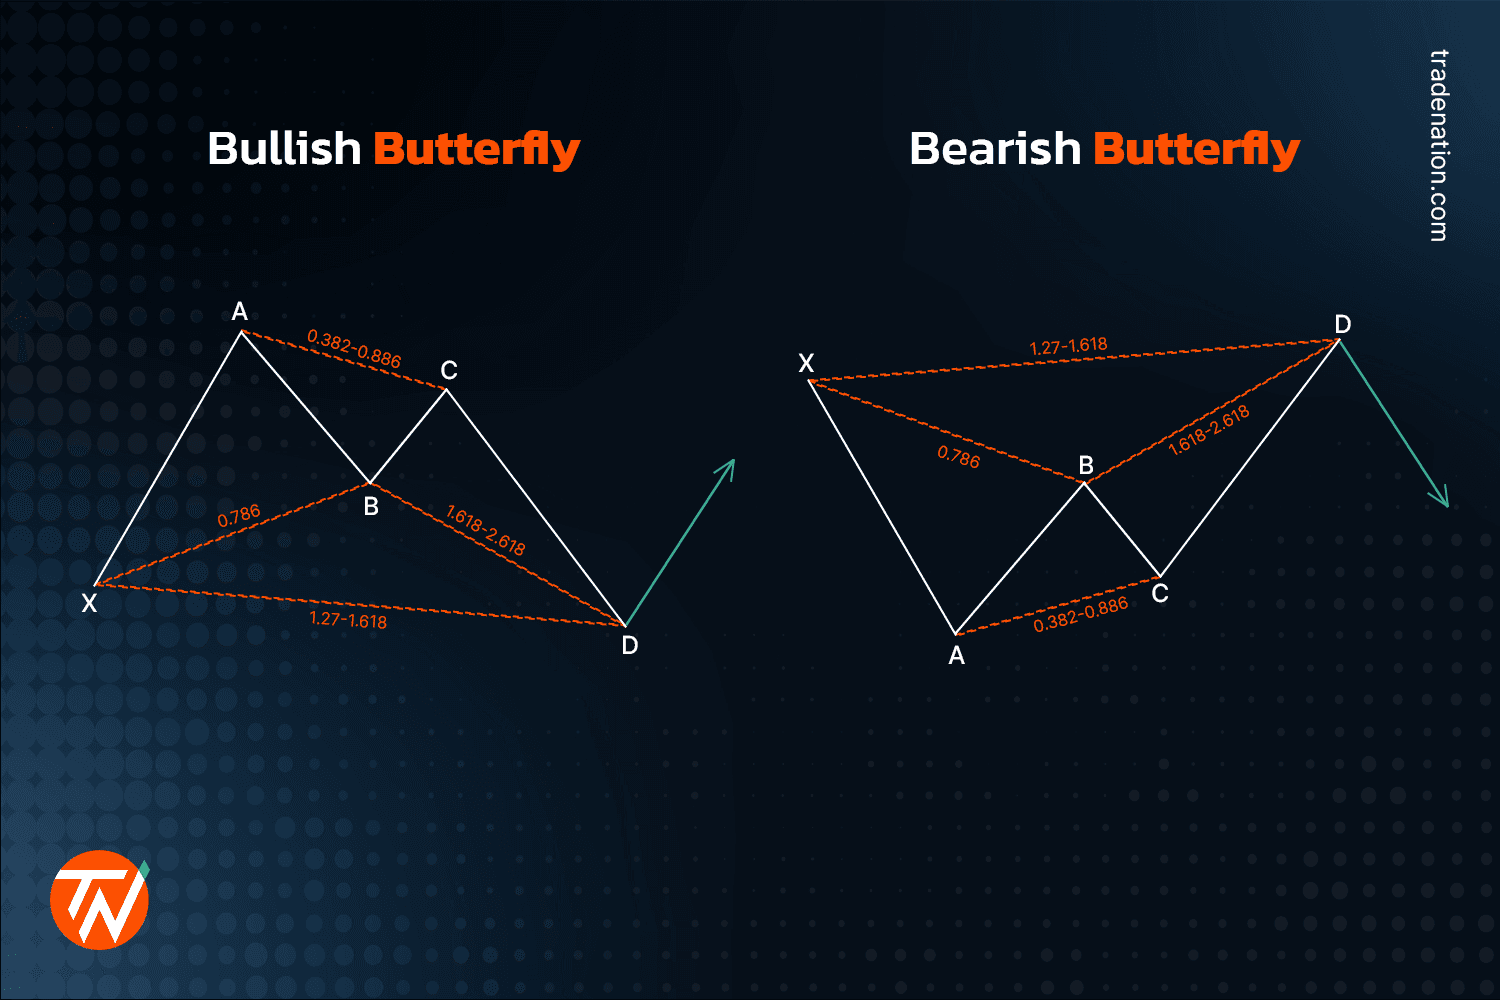
Bullish butterfly and bearish butterfly demonstrated

Crab harmonic pattern

Yet another Scott Carney discovery, the crab follows an X-A, A-B, B-C, and C-D pattern, allowing traders to enter the market at extreme highs or lows. The 1.618 extension of the XA leg to the CD leg that defines it is the most crucial characteristic of the crab pattern.

The first leg of the crab in its bullish variant emerges when the price climbs significantly from point X to point A. The AB leg retraces 38.2% to 61.8% of XA. This is followed by an extreme projection of BC (2.618 - 3.618), which defines a viable region for pattern completion and likely trend reversal.

A bearish crab will follow a price drop from point X to point A, then a minor price gain, a tiny drop, then a rapid climb to point D.

In the case of a bullish crab, once point D is identified, traders wait for a start of a selloff to enter and place a stop loss above point D. The opposite is done while trading a bearish crab harmonic pattern.
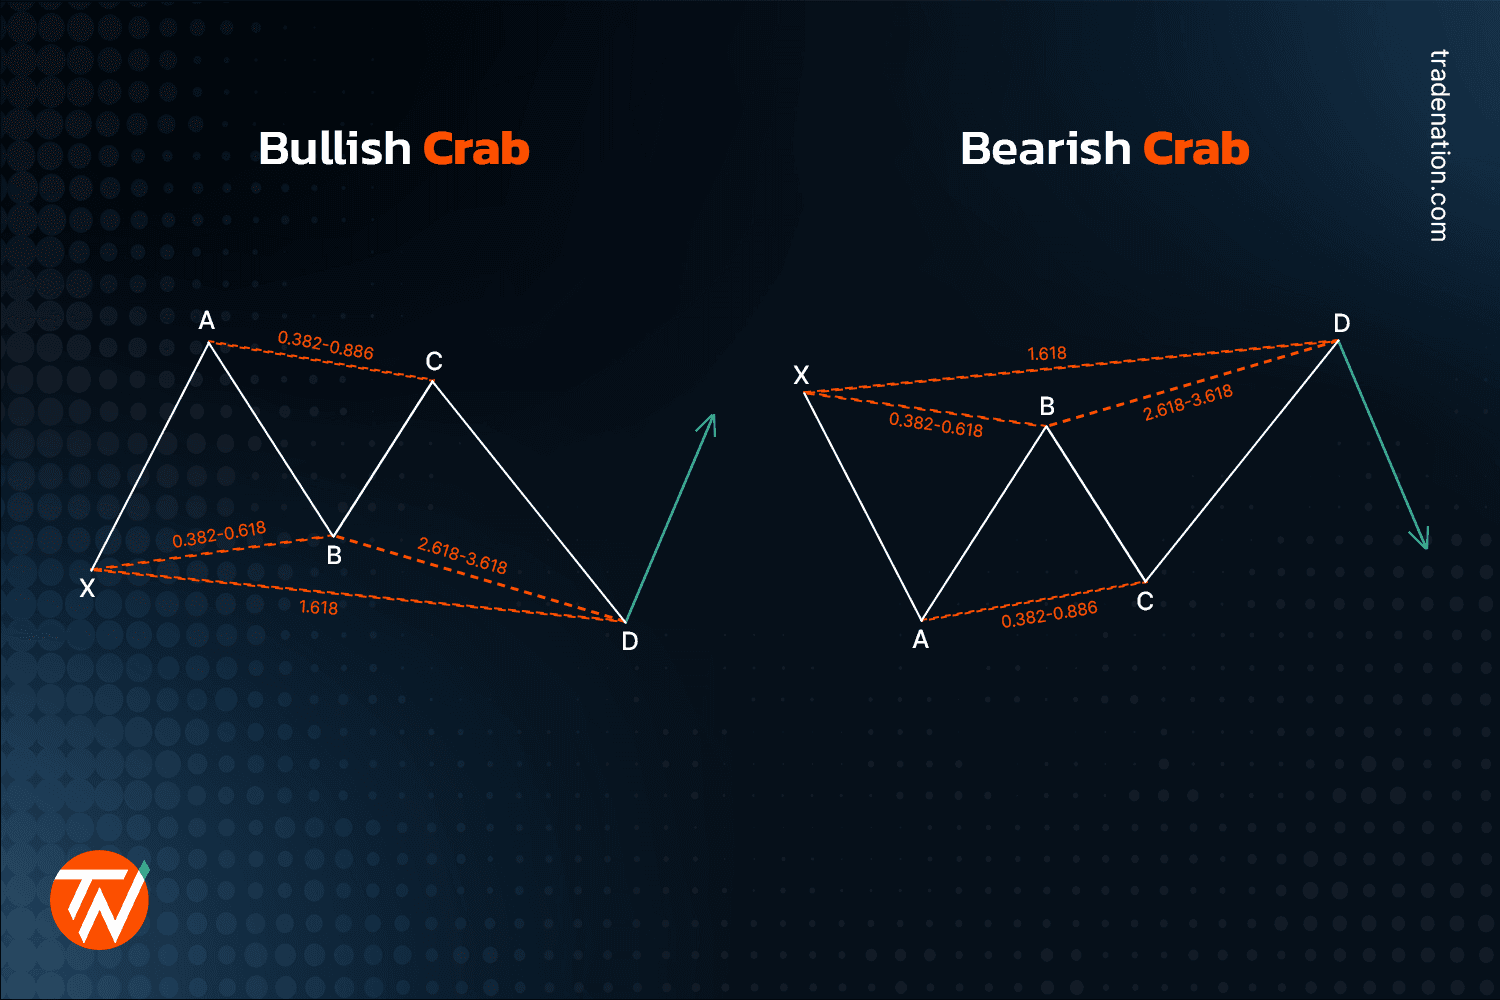
Bullish crab and bearish crab demonstrated

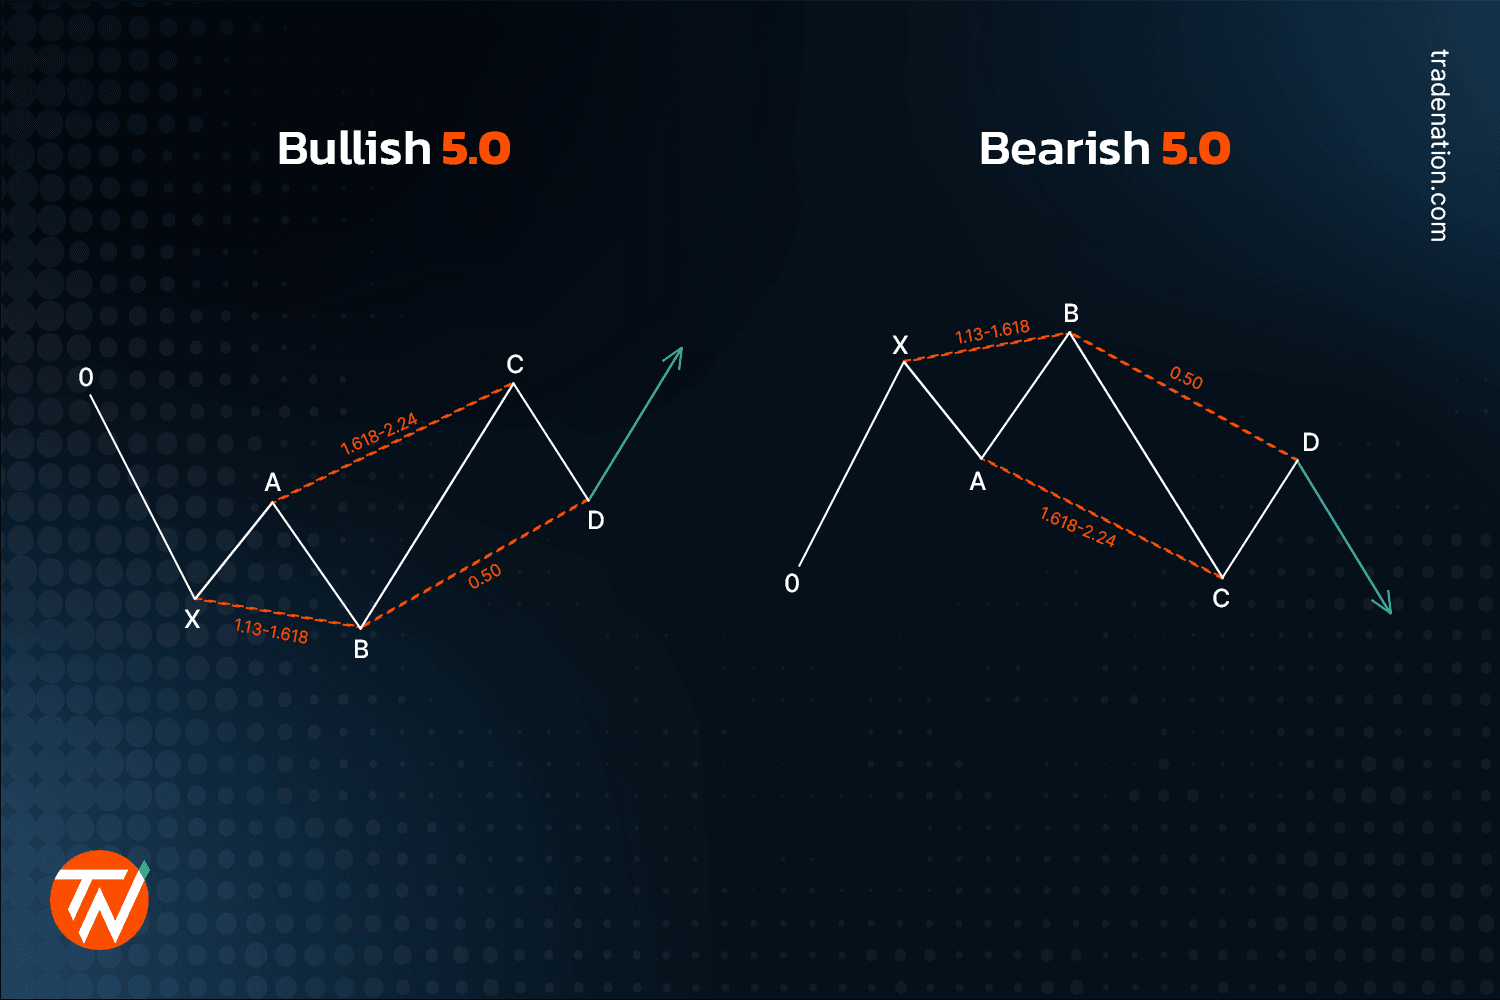
5.0 harmonic pattern

This is a little more complicated pattern since it includes an ABCD as well as the leg before it. Here are the Fibonacci levels to look for a bullish 5.0 harmonic pattern:

  • A leg down labelled 0X, and a leg up labelled XA 
  • AB is a down leg that extends from 1.13 to 1.618 beyond point X 
  • BC is again a leg up that extends from 1.618 to 2.24 of XA
  • In the end, the CD is a leg down that retraces 0.50 of BC. 

In case of a bullish 5.0 harmonic pattern, you should wait for the price to rise from point D before entering the market. As we do not yet know if the price will move as predicted, there is no trade if the price continues to fall; only if the price rises will there be a trade.

Once the price rises, a stop-loss is placed below the swing low produced at point D. Profit targets are predicted between points D and C, although they might also be projected above C. The bearish pattern functions similarly, except the opposite in formation and bias.

Bullish and bearish 5.0 demonstrated

The markets are moving.

Start trading now.

Get startedarrow-icon
arrow-icon

Limitations of harmonic patterns

Harmonic patterns are usually precise in that they require the pattern to display movements of specific retracements for the pattern's unfolding to produce an appropriate reversal point. A trader may notice a pattern that appears to be a harmonic pattern, but if the Fibonacci levels do not coincide, this will render the pattern untrustworthy. This might be very important because it necessitates the trader's patience in waiting for good setups.

Harmonic patterns may be used to predict how long present trends will continue, but they can also be used to pinpoint reversal points. The risk arises when a trader enters the reversal region, and the pattern fails. When this occurs, the trader may become trapped in a position where the trend swiftly goes against them. As a result, risk management is essential in all trading techniques.

It is also essential to realise that patterns can occur within other patterns, and non-harmonic patterns can (and almost certainly will) exist within the framework of harmonic patterns. These can boost the harmonic pattern's usefulness and improve entry and exit techniques. 

Prices are always fluctuating. Therefore it is critical to keep an eye on the overall picture of the traded time frame. Because markets are fractal, the idea may be applied from the smallest to the greatest time frames. However, it's not necessary that what seems right on one timeframe may also look right on the higher one.

A charting tool that allows a trader to plot several Fibonacci retracements to measure each leg is required to use harmonic patterns in a trading strategy.

Final thoughts

Harmonic trading is a precise and quantitative approach to trading, but mastering the patterns takes time, experience, and a lot of research. Movements that do not align with the correct pattern measures invalidate the pattern and might lead traders into losing positions.

When price confirmation shows a reversal, entries are made within the possible reversal zone. Stop losses are put slightly below a long entry, above a short entry, or alternatively outside the pattern's farthest projection.


People also asked

/

Harmonic patterns may be used to predict reversal points and how long a market trend will stay intact. They can be extremely accurate patterns that require precise calculations.

/

All financial markets, including forex, equities, commodities, and others, can be traded with harmonic patterns.

/

Harmonic patterns generally have a higher success rate when compared to other technical indicators.

/

H. M. Gartley first introduced harmonic patterns, while Scott Carney developed many other patterns.

/

All popular harmonic patterns operate with roughly the same efficiency. However, the bat harmonic pattern is the most precise one, according to Scott Carney.

Suggested articles

See allarrow-icon
arrow-icon

Gain the edge

Sign up and unlock early
access to exclusive trading
insights and educational tips.

I confirm I am 18 years old or above.

By signing up to hear from us, you agree to our terms and privacy policy.

Please keep me updated on Trade Nation’s sponsorships, news, events and offers.

The markets are moving.

Start trading now.

Get startedarrow-icon
arrow-icon

Trade on our
award-winning
platform


en-za

Payment methods

Visa card payment method
Mastercard payment method

Trade on

Regulatory bodies

UK - FCA

Australia - ASIC

Seychelles - FSA

Bahamas - SCB

South Africa - FSCA

Customer support

Sponsors of your favourite teams

The legal stuff

Trading CFDs carries a high level of risk to your capital, and you should only trade with money you can afford to lose. Refer to our legal documents.

Trade Nation is a trading name of Trade Nation Financial (Pty) Ltd, a financial services company registered in South Africa under number 2018 / 418755 / 07, is authorised and regulated by the Financial Sector Conduct Authority (FSCA), with licence number 49846. Our registered office is 19 9th Street, Houghton Estate, Johannesburg, Gauteng, 2198 South Africa.

Finalto (South Africa) (Pty) Limited (“Finalto”), a registered FSP holding a Category I license under FAIS, and an authorized OTC Derivatives Provider (“ODP”) in terms of the Financial Markets Act, 2012 under license no. 46860. 

Finalto provides Trade Nation with a comprehensive ODP regulatory status and liquidity solution. This partnership ensures that Trade Nation Financial (Pty) Ltd is FAIS Compliant and benefits from Finalto's robust regulatory ODP framework and liquidity provision, facilitating secure and efficient trading operations. 

Trade Nation is a trading name of Trade Nation Financial UK Ltd, a financial services company registered in England & Wales under company number 07073413, is authorised and regulated by the Financial Conduct Authority under firm reference number 525164. Our registered office is 14 Bonhill Street, London, EC2A 4BX, United Kingdom. 

Trade Nation is a trading name of Trade Nation Australia Pty Ltd, a financial services company registered in Australia under number ACN 158 065 635, is authorised and regulated by the Australian Securities and Investments Commission (ASIC), with licence number AFSL 422661. Our registered office is Level 17, 123 Pitt Street, Sydney, NSW 2000, Australia. 

Trade Nation is a trading name of Trade Nation Ltd., a financial services company registered in the Bahamas under number 203493 B, is authorised and regulated by the Securities Commission of the Bahamas (SCB), with licence number SIA-F216. Our registered office is No. 3 Bayside Executive Park, West Bay Street & Blake Road, Nassau, New Providence, The Bahamas.

Trade Nation is a trading name of Trade Nation Financial Markets Ltd, a financial services company registered in the Seychelles under number 810589-1, is authorised and regulated by the Financial Services Authority of Seychelles (FSA) with licence number SD150. Our registered office is CT House, Office 6B, Providence, Mahe, Seychelles. 

The information on this site is not directed at residents of the United States or any particular country outside the UK, Australia, South Africa, The Bahamas or Seychelles and is not intended for distribution to, or use by, any person in any country or jurisdiction where such distribution or use would be contrary to local law or regulation. 

© 2019-2024 Trade Nation. All Rights Reserved